Choose Your Region
Choose Your Region
- Australia (English)
- Brasil (Português)
- China (简体中文)
- Deutschland (Deutsch)
- España (Español)
- France (Français)
- Hong Kong (English)
- India (English)
- Italia (Italiano)
- Latinoamérica (Español)
- Nederland (Nederlands)
- Singapore (English)
- Türkiye (Türkçe)
- United Kingdom (English)
- United States (English)
- 台灣 (繁體中文)
- 日本 (日本語)
- 대한민국 (한국어)
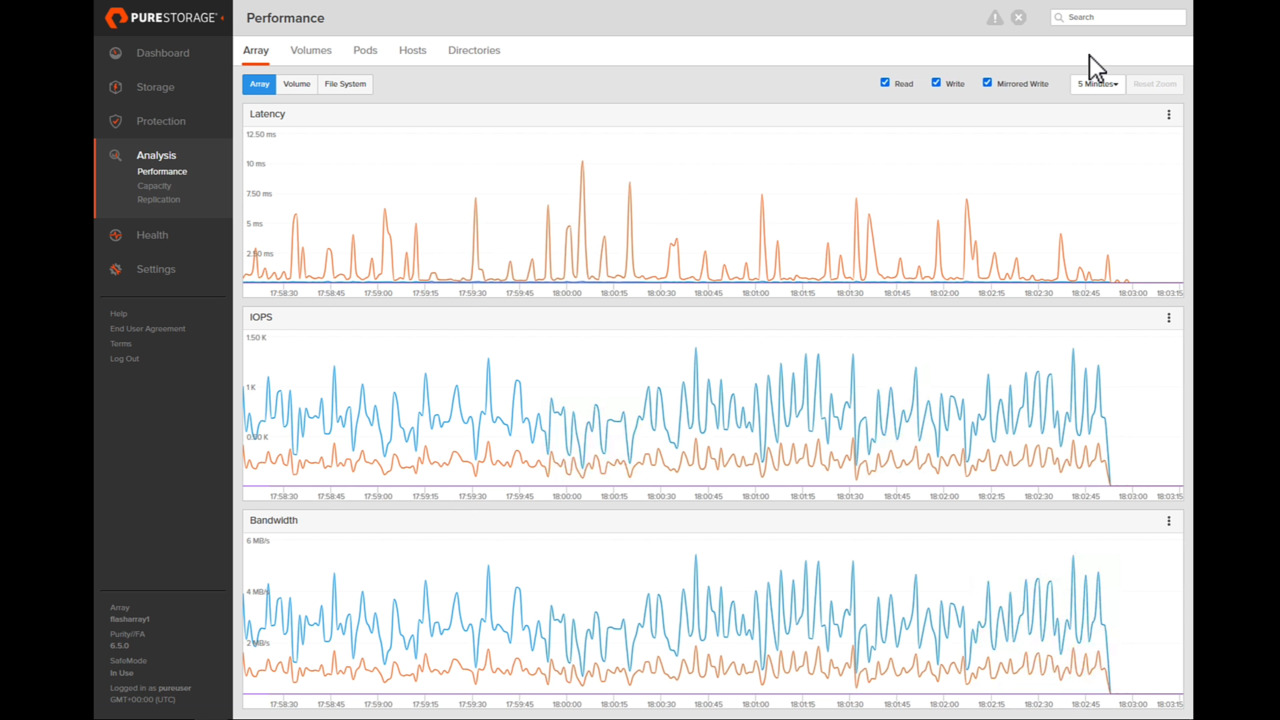
FlashArray Deep Dive Part 3 - Performance and Health Monitoring
In the final segment of this three-part walkthrough on Everpure FlashArray, learn the ins and outs of monitoring the performance and overall health of FlashArray.
Share
Watch Now
Resume Watching
Ready to connect?
Watch more from this series
Completion
Unlock premium content.
* indicates a required field.
Gain exclusive access to all premium Pure360 demo content and explore even more in-depth insights and features of the Everpure platform.
This site is protected by reCAPTCHA and the Google Privacy Policy and Terms of Service apply.
{"items":[{"sourceType":"field","htmlId":"FirstName","label":"First Name:","valuesDropDown":[],"resourceName":"item"},{"sourceType":"field","htmlId":"LastName","label":"Last Name:","valuesDropDown":[],"resourceName":"item_832259886"},{"sourceType":"field","htmlId":"Email","label":"Work Email:","valuesDropDown":[],"resourceName":"item_1226277466"},{"sourceType":"field","htmlId":"Phone","label":"Phone Number:","valuesDropDown":[],"resourceName":"item_1083607498"},{"sourceType":"field","htmlId":"Company","label":"Company Name:","valuesDropDown":[],"resourceName":"item_407296633"},{"sourceType":"field","htmlId":"Title","label":"Job Title:","valuesDropDown":[],"resourceName":"item_1536030190"},{"sourceType":"field","htmlId":"Country","label":"Country:","valuesDropDown":[],"resourceName":"item_1919726167"},{"sourceType":"field","htmlId":"sessiontime","label":"Choose your preferred time:","valuesDropDown":[],"resourceName":"item_1328836745"},{"sourceType":"field","htmlId":"Description_Other__c","placeholderText":"What would you like to talk to us about?","label":"What would you like to talk to us about?","valuesDropDown":[],"resourceName":"item_107231206"},{"sourceType":"values","htmlId":"Description_Other__c","valuesDropDown":[{"key":"Choose one","text":"Choose one"},{"key":"VMware and Virtualization","text":"VMware and Virtualization"},{"key":"Cloud or Hybrid Cloud Solutions","text":"Cloud or Hybrid Cloud Solutions"},{"key":"AI and Analytics","text":"AI and Analytics"},{"key":"Data Protection and Cyber Resilience","text":"Data Protection and Cyber Resilience"},{"key":"Databases and Business Applications","text":"Databases and Business Applications"},{"key":"All Other Sales Inquiries","text":"All Other Sales Inquiries"}],"resourceName":"item_1853297185"},{"sourceType":"field","htmlId":"Question","placeholderText":"How can we help?","label":"How can we help?","valuesDropDown":[],"resourceName":"item_2107803381"},{"sourceType":"checkbox","htmlId":"Explicit_Opt_in__c","description":"\u003cp\u003eBy checking this box, I authorise Everpure, Inc. and its affiliates (\u0026quot;Everpure\u0026quot;) and its authorised partners to use my personal data in order to receive information and updates regarding Everpure products, services, surveys and events.\u003c/p\u003e\r\n\u003cp\u003eThe information you provide us will be used in accordance with the terms of the Everpure\u0026nbsp;\u003ca href\u003d\"/content/purestorage-com-live/en_us/privacy.html\" target\u003d\"_self\"\u003ePrivacy Policy\u003c/a\u003e\u003c/p\u003e\r\n","valuesDropDown":[],"resourceName":"item_713216797"},{"sourceType":"ccpa","htmlId":"ccpa_notice","description":"\u003cp\u003eEverpure uses the personal data you submit (including name, phone, email, company, job title, location in the form) to provide you with relevant information and help process any orders you may place through Everpure or our partners. By clicking submit you agree to sharing of this personal data with Everpure and our partners and related third parties.\u003cbr /\u003e\r\n\u003cbr /\u003e\r\nYou have the right to request deletion of your personal data, and the right to opt-out of sale of your personal data. \u003ca href\u003d\"/content/purestorage-com-live/en_us/privacy.html#ccpa\" target\u003d\"_self\"\u003ePrivacy Notice\u003c/a\u003e\u003c/p\u003e\r\n","valuesDropDown":[],"resourceName":"item_547565321"}]}
Personalize for Me
Personalize your Everpure experience
Select a challenge, or skip and build your own use case.
Future-proof virtualization strategies
Storage options for all your needs
Enable AI projects at any scale
High-performance storage for data pipelines, training, and inferencing
Protect against data loss
Cyber resilience solutions that defend your data
Reduce cost of cloud operations
Cost-efficient storage for Azure, AWS, and private clouds
Accelerate applications and database performance
Low-latency storage for application performance
Reduce data center power and space usage
Resource efficient storage to improve data center utilization
Confirm your outcome priorities
Your scenario prioritizes the selected outcomes. You can modify or choose next to confirm.
Primary
Reduce My Storage Costs
Lower hardware and operational spend.
Primary
Strengthen Cyber Resilience
Detect, protect against, and recover from ransomware.
Primary
Simplify Governance and Compliance
Easy-to-use policy rules, settings, and templates.
Primary
Deliver Workflow Automation
Eliminate error-prone manual tasks.
Primary
Use Less Power and Space
Smaller footprint, lower power consumption.
Primary
Boost Performance and Scale
Predictability and low latency at any size.
Start Over
Select an outcome priority
Select an outcome priority
Next
What’s your role and industry?
We've inferred your role based on your scenario. Modify or confirm and select your industry.
Select your industry
Financial services
Government
Healthcare
Education
Telecommunications
Automotive
Hyperscaler
Electronic design automation
Retail
Service provider
Transportation
Which team are you on?
Technical leadership team
Defines the strategy and the decision making process
Infrastructure and Ops team
Manages IT infrastructure operations and the technical evaluations
Business leadership team
Responsible for achieving business outcomes
Security team
Owns the policies for security, incident management, and recovery
Application team
Owns the business applications and application SLAs
Back
Select an industry
Select a team
Select a team
Select an industry
Select a team
Select a team
Next
Describe your ideal environment
Tell us about your infrastructure and workload needs. We chose a few based on your scenario.
Select your preferred deployment
Hosted
Dedicated off-prem
On-prem
Your data center + edge
Public cloud
Public cloud only
Hybrid
Mix of on-prem and cloud
Select the workloads you need
Databases
Oracle, SQL Server, SAP HANA, open-source
Key benefits:
- Instant, space-efficient snapshots
- Near-zero-RPO protection and rapid restore
- Consistent, low-latency performance
AI/ML and analytics
Training, inference, data lakes, HPC
Key benefits:
- Predictable throughput for faster training and ingest
- One data layer for pipelines from ingest to serve
- Optimized GPU utilization and scale
Data protection and recovery
Backups, disaster recovery, and ransomware-safe restore
Key benefits:
- Immutable snapshots and isolated recovery points
- Clean, rapid restore with SafeMode™
- Detection and policy-driven response
Containers and Kubernetes
Kubernetes, containers, microservices
Key benefits:
- Reliable, persistent volumes for stateful apps
- Fast, space-efficient clones for CI/CD
- Multi-cloud portability and consistent ops
Cloud
AWS, Azure
Key benefits:
- Consistent data services across clouds
- Simple mobility for apps and datasets
- Flexible, pay-as-you-use economics
Virtualization
VMs, vSphere, VCF, vSAN replacement
Key benefits:
- Higher VM density with predictable latency
- Non-disruptive, always-on upgrades
- Fast ransomware recovery with SafeMode™
Data storage
Block, file, and object
Key benefits:
- Consolidate workloads on one platform
- Unified services, policy, and governance
- Eliminate silos and redundant copies
What other vendors are you considering or using?
Back
Select a deployment
Select a workload
Select a workload
Select a deployment
Select a workload
Select a workload
Finish
Thinking...