지리공간 데이터 애플리케이션
- 환경 보호: 지리 공간 데이터는 산림 화재가 발생하는 동안 이를 감지하고 그 영향을 문서화하는 데 도움이 될 수 있습니다.
- 농업: 농부들은 지리공간 데이터를 사용하여 작물의 진척도를 추적하고 작물 상태를 평가할 수 있습니다.
- 물류: 운송 회사는 지리공간 데이터를 사용하여 선적 중인 상품을 추적하고, 경로를 생성하고, 도착 및 출발 시간을 예측합니다.
- 기상학: 과학자들과 연구원들은 기상 이벤트의 진행 상황을 추적하고 허리케인과 같은 이벤트가 발생하기 전에 미리 알림을 공유할 수 있습니다.
- 헬스케어: 연구자들은 지리공간 데이터를 통해 질병 발생의 확산을 추적할 수 있습니다.
- 리테일: 지리 공간 데이터는 소매업체가 오프라인 매장 근처의 지리적 영역에 있는 고객의 소득 수준, 인구 밀도, 연령 및 위치를 파악하여 매장이 판매할 제품과 브랜드를 결정할 수 있도록 지원합니다.
지리 공간 데이터의 유형
지형공간 데이터는 벡터 데이터와 래스터 데이터의 두 그룹으로 나뉩니다.
벡터 데이터는 물리적 위치를 나타내는 포인트로 생성됩니다. 포인트는 아래 설명된 대로 선이나 다각형으로 결합할 수 있습니다.
- 포인트 데이터: 포인트 데이터는 학교 및 교량과 같은 특정 데이터 포인트를 나타냅니다. 또한 장소 이름 및 도시 위치를 나타내는 데에도 사용할 수 있습니다.
- 라인 데이터(아크 데이터라고도 함): 라인 데이터는 시작점과 끝점이 있는 거리, 트레일 또는 강과 같은 선형 기능을 나타내는 데 사용됩니다.
- 다각형 데이터: 다각형은 도시 경계, 공원 또는 호수와 같은 지역을 나타내는 데 사용됩니다.
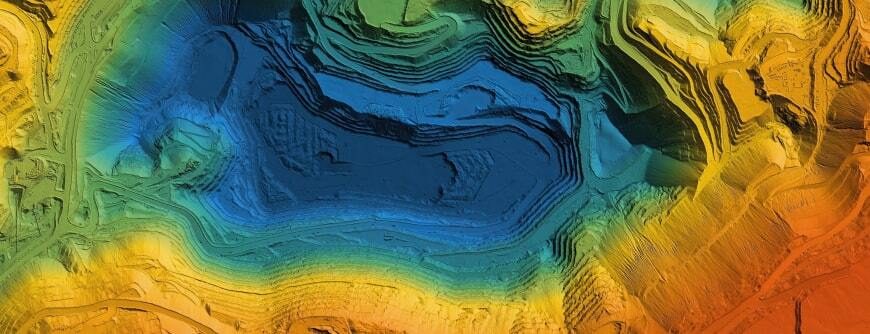
래스터 데이터는 픽셀 또는 셀로 생성됩니다. 래스터 형식으로 저장된 데이터는 위성 이미지, 항공 사진 또는 디지털 이미지에서 얻을 수 있습니다. 래스터 데이터는 토지 사용이나 나무 커버, 심지어 온도나 고도와 같은 기능을 나타내는 데 사용될 수 있습니다.
지리 공간 데이터 사용의 이점
지리 공간 데이터를 시각화함으로써 의사결정권자는 중요한 비즈니스 데이터가 시간이 지남에 따라 어떻게, 어디에서 변경되는지 보다 쉽게 확인할 수 있습니다. 애플리케이션은 다음과 같습니다.
변화 및 이벤트 예측: 지리 공간 데이터는 시간적(시간 기반) 정보를 포함하기 때문에, 연구원들은 이를 사용하여 향후 시간에 따른 변화를 예측할 수 있습니다. 데이터는 예를 들어, 인구 밀도의 변화에 따라 기업이 새로운 위치를 개설할 위치를 결정하는 데 도움이 될 수 있습니다. 가뭄이나 홍수를 겪는 곳에서 연구원들은 미래에 재해가 발생할 수 있다는 징후를 찾고 의사 결정권자에게 생명을 구하거나 작물을 구할 수 있는 조치를 취하도록 알릴 수 있습니다.
인구 통계에 대한 이해: 인구, 교육 수준 및 소득의 변화를 보여주는 표는 현지 시민 또는 잠재 고객에 대한 이야기를 전달하는 데 도움이 될 수 있습니다. 그러나 이러한 데이터를 위치 데이터와 결합하면 의사결정권자는 변화가 일어나고 있는 위치를 확인할 수 있습니다.
제품 및 솔루션 타겟팅: 지리 공간 데이터를 분석하면 제품 및 전략이 한 지역에서는 성공할 수 있지만 다른 지역에서는 실패할 수 있는 이유를 파악할 수 있습니다.
퓨어스토리지를 통해 지리공간 데이터의 도전과제 해결
지리 공간 데이터는 맵의 이미지나 포인트 그 이상입니다. 장소나 이벤트를 지도 상의 지점에 연결하므로, 특히 시간이 지남에 따라 지리공간 데이터를 볼 때 인간 활동이 지리적 위치에 미치는 영향을 더 잘 이해할 수 있습니다. 그러나 이를 저장하는 것은 고유한 도전과제를 야기할 수 있습니다.
지리공간 데이터 문제를 해결하기 위해 퓨어스토리지®는 다음과 같은 다양한 솔루션을 제공합니다.
플래시플래시블레이드(FlashBlade)FlashArray의 고밀도, 낮은 전력 소비 및 간편한 원격 관리는 엣지 위치에 배치하는 데 이상적입니다.
또한, 퓨어스토리지의 Portworx®는 클라우드 네이티브 워크로드를 엣지에서 실행할 수 있는 스토리지 레이어를 제공합니다. 백업 및 Disaster Recovery를 포함한 컨테이너화된 워크로드를 위한 완벽한 솔루션을 제공합니다. Portworx 플래시블레이드(FlashBlade) 및 FlashArray와 통합되어 높은 성능과 안정성을 제공합니다.