地理空間データのアプリケーション
- 環境保護:地理空間データは、発生中の森林火災を検出し、その影響を文書化するのに役立ちます。
- 農業:農家は地理空間データを活用して作物の生育状況を追跡し、作物の健康状態を評価することができます。
- ロジスティクス:輸送会社は、地理空間データを使用して、出荷中の商品を追跡し、ルートを作成し、到着と出発の時間を見積もっています。
- 気象学:科学者や研究者は、気象イベントの進捗状況を追跡し、ハリケーンなどのイベントの前にアラートを共有することができます。
- 医療・ヘルスケア:研究者は、地理空間データを用いて疾病発生の拡大を追跡できます。
- 小売業:地理空間データは、店舗がどの製品やブランドを販売するかを決定できるように、実店舗に近い地理的エリアの顧客の所得レベル、人口密度、年齢、場所を理解するのに役立ちます。
地理空間データの種類
地理空間データは、ベクトル・データとラスター・データの 2 つのグループに分類されます。
ベクトル・データは、物理的な位置を示す点によって作成されます。以下に説明するように、点(ポイント)を線(ライン)や多角形(ポリゴン)として結ぶことができます。
- ポイント・データ:ポイント・データは、学校や橋などの特定のデータ・ポイントを表します。また、場所名や市区町村を表すためにも使用できます。
- ライン・データ(アーク・データとも呼ばれる):ライン・データは、始点と終点を持つ道路、小道、河川などの線形特徴を表すために使用されます。
- ポリゴン・データ:多角形は、都市の境界、公園、湖などのエリアを表すために使用されます。
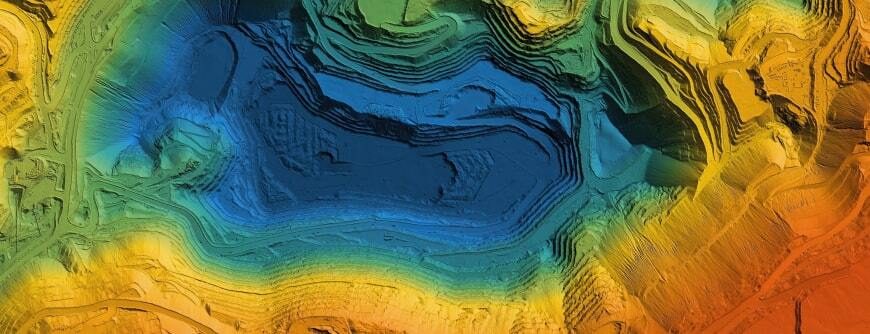
ラスター・データは、ピクセルまたはセルで作成されます。ラスター形式で保存されるデータは、衛星画像、航空写真、デジタル画像から取得できます。ラスター・データは、土地利用や樹木被覆などの特徴を表すほか、気温や標高などのデータを表すためにも使用できます。
地理空間データを使用するメリット
地理空間データを可視化することで、重要なビジネス・データが時間や場所とともにどのように変化しているかを意思決定者が容易に把握できます。アプリケーションには、次のようなものがあります。
変化とイベントの予測:地理空間データには時間的(時間ベースの)情報が含まれているため、研究者はそれを使用して将来の変化を予測できます。データは、例えば、人口密度の変化に基づいて、新規出店場所を決定するのに役立ちます。干ばつや洪水に見舞われている地域では、研究者は将来的に壊滅的な災害が発生する可能性を示す兆候を探し、意思決定者に対して人命や作物を救うための対策を講じるよう警告することができます。
人口統計の理解:人口、教育水準、所得の変化を示す表は、地域住民や潜在顧客に関するストーリーを伝える一助となります。しかし、このデータと位置情報データを組み合わせることで、意思決定者は変化が起こっている状況を把握できます。
対象とする製品とソリューション:地理空間データの分析は、製品や戦略がある地域では成功する一方で、別の地域では失敗する理由を明らかにする手がかりとなります。
ピュア・ストレージが地理空間データの課題を解決
地理空間データは、地図上の画像やポイント以上のものです。場所やイベントを地図上のポイントと結びつけることで、特に地理空間データを時系列で見る際に、人間の活動が地理的位置に与える影響をより深く理解できるようになります。しかし、その保存には特有の課題が生じることがあります。
ピュア・ストレージは、地理空間データの課題を解決するために、次のようなソリューションを提供しています。
FlashBlade と FlashArray の両方の高密度、低消費電力、容易なリモート管理により、エッジ・ロケーションでの展開に最適です。
さらに、ピュア・ストレージの Portworx は、クラウドネイティブなワークロードをエッジで実行するためのストレージ層を提供します。バックアップやディザスタ・リカバリなど、コンテナ化されたワークロードのための完全なソリューションを提供します。Portworx は FlashBlade と FlashArray の両方と統合され、高性能と信頼性を実現します。